
专注体育运动场材料领域 塑百年品牌 创环保跑道
400-928-9558
18912360877
18912360877

材料组成:预制型跑道具有安全、环保、优异的耐候性,经济耐用,多色彩效果,安装便捷,使用配套提供的专用粘接剂,在少量人力和机械条件下,即可进行跑道卷材的施工。理化性能全面符合新国标GB36246-2018 的指标要求。
查看产品详情材料组成:渗水型跑道又称透气型跑道。在跑道系列中,它是唯一拥有渗水功能的跑道类型,施工简单、快捷,是目前塑胶跑道面层的主流产品之一。透气型跑道采用高弹性 EPDM 彩色颗粒粘接环保胶水摊铺,弹性好、成本低,保证运动场地的环保。理化性能全面符合新国标 GB36246-2018 的指标要求。
查看产品详情材料组成:混合型跑道采用国际田联认可的混合结构,弹性层由环保的双组份聚氨酯混合料加入 EPDM彩色颗粒摊铺到相应的厚度,呈平整、密实结构,具备优越的物理性能和良好外观,得到市场的广泛认可。面层由 EPDM 彩色颗粒与单组份聚氨酯喷面胶混合喷涂而成,也可采用撒颗粒的方式。理化性能全面符合新国标 GB36246-2018 的指标要求。
查看产品详情材料组成:复合型跑道介于渗水型和混合型跑道之间,弹性层采用 EPDM 彩色颗粒摊铺,弹性好,成本低,中间用环保的双组份聚氨酯混合料刮涂封闭加固,面层由 EPDM 彩色颗粒与单组份聚氨酯喷面胶混合喷涂而成。表层稳固,高耐磨性能,不易脱粒,确保使用寿命。理化性能全面符合新国标 GB36246-2018的指标要求。
查看产品详情材料组成:全塑型跑道呈平整密实结构,主要成分是双组份聚氨酯材料,弹性层由双组份聚氨酯混合料一体成型,面层由 EPDM 彩色颗粒与单组份聚氨酯喷面胶混合喷涂而成。理化性能全面符合新国标GB36246-2018 的指标要求。
查看产品详情材料组成:EPDM 球场主要由高聚物含量大于 20%的 EPDM 彩色胶粒与聚氨酯胶黏剂组成,是固定式的运动场地材料。全天候使用,不会因紫外线,酸雨等的污染而褪色,能长期保持其高水准的运动性能。理化性能全面符合新国标 GB36246-2018 的指标要求。
查看产品详情 产品介绍
1.同簇双型“W+S”升级型。
2.为满足高端客户需求,故推出W+S/PLUS型,提升了草坪的磅重、密度,对S型和W型草丝加宽加厚,使得草丝直立性和耐磨性进一步提升。
3.S型草丝,耐磨度高于单丝加筋型草丝;W型草丝,直立性高于C型草丝,远超其他同类产品。
4.已成熟运用于上海申花足球俱乐部训练基地等项目。
产品介绍
1.同簇双型“W+S”型。
2.为同时解决草丝的耐磨性与直立性的矛盾问题,新开发出同簇S型和W型草丝,使得S型草丝保证其耐磨性,W型草丝保证其直立性和反弹力。
3.大幅度提升草丝使用寿命、抗老化、抗紫外线、抗菌等效果。
4.S型草丝,耐磨度高于单丝加筋型草丝;W型草丝,直立性高于C型草丝,两者结合。
产品介绍
1.双S重合型草丝。
2.草丝截面呈双S状,大幅度增强了草丝的挺拔度和直立效果。
3.双S型草丝具有回弹性、耐磨性和防滑性。
4.草丝色泽自然,仿真度可与天然草媲美,铺装效果好。
5.采用进口抗UV、抗老化、抗紫外线材料。
产品介绍
1.市面主流成熟型单丝加筋草。
2.进口原材料、助剂。
3.草坪抗紫外线和耐磨性能达到较高水平。
4.单丝加筋草丝不仅加强了草丝的挺拔度、耐磨性,还进一步提高了直立仿真效果。
5.草丝色泽自然,平整柔软,可以和天然草相媲美。
产品介绍
1.产品配方、生产工艺标准,第五代免填充草。
2.草丝截面呈C状,增强了草丝的排水性和直立性。曲丝增强了草坪的回弹性和防滑性。
3.草坪耐磨性能卓越,寿命长,可高频率使用。
4.无需填充石英砂、橡胶颗粒,铺装更方便,更环保。
5.便于拆装、可重复使用。
产品介绍
1.专利型产品,直丝为双S设计,保证其直立性、无倒向性,耐磨性,曲丝采用耐磨菱形草丝。
2.解决免填充草坪阻力、倒向性、回弹、安全性、平整度的问题。
3.高磅重曲丝,规格远超其他同类产品,曲度明显,底盘厚实,保证草缓冲效果及增加摩擦力,能很好的起到保护运动员的作坪回弹性。
4.脚感舒适,具有优良的减震作用。
1、防紫外光、色泽稳定、防磨损、防爆裂、抗老化、寿命长;
2、无起泡、无拼接缝隙、颜色多种、可随意搭配;
3、可全天候使用、弹性好、耐磨性强、耐候性佳、耐压缩性强、抗钉力强、耐冲击佳、平整;
4、EPDM颗粒的性能:质优的EPDM颗粒具有良好的物理性能,可以拉伸到一定程度而不断裂;
一种热塑性弹性体材料,具有高强度,高回弹性,可注塑加工的特征,应用范围广泛,环保无毒安全,有优良的着色性,其物理机构性能、加工性能及制品的使用性能接近于天然橡胶,有些性能如耐磨、耐热、耐候、耐老化能力较天然橡胶更为优良,更是兼具橡胶和塑料的优点。
查看产品详情 1、防紫外光、色泽稳定、防磨损、防爆裂、抗老化、寿命长;
2、无起泡、无拼接缝隙、颜色多种、可随意搭配;
3、可全天候使用、弹性好、耐磨性强、耐候性佳、耐压缩性强、抗钉力强、耐冲击佳、平整;
4、EPDM颗粒的性能:质优的EPDM颗粒具有良好的物理性能,可以拉伸到一定程度而不断裂;
一种热塑性弹性体材料,具有高强度,高回弹性,可注塑加工的特征,应用范围广泛,环保无毒安全,有优良的着色性,其物理机构性能、加工性能及制品的使用性能接近于天然橡胶,有些性能如耐磨、耐热、耐候、耐老化能力较天然橡胶更为优良,更是兼具橡胶和塑料的优点。
查看产品详情人造草坪减震垫,是一种仿真人造草坪减震软垫基础产品,采用聚乙烯交联XPE发泡片材,具有隔音好,防水防潮、无毒环保、回弹力好,重量轻、使用寿命长等特点,可以通过冲孔或开槽工艺解决草坪垫排水问题,产品应用广泛:主要应用在足球场、橄榄球场、曲棍球场、高尔夫打击垫、高尔夫果岭、幼儿安全地面系统、网球草场、体育休闲区等。
查看产品详情球场围网是专为体育场设计的新型防护产品,此品网体高、防攀爬能力强。它又被称为:"体育场围网",可以在现场施工安装围柱,围网,产品最大特点是灵活性强,可根据要求随时调整网片的结构,造型和尺寸。体育场围网特别适用于高度4米以内的作为球场围网、篮球场围网、排球场地和体育训练场地使用, 具有防腐、防老化、抗晒、耐候、色彩鲜亮、网面平整,强力张紧,不易受外力撞击变形、现场施工安装、灵活性强(可根据现场要求随时调整造型和尺寸)。
查看产品详情照明对于凯发K8的现代生活是至关重要的。无论它是用于照明住宅、办公场所、公共建筑,还是用于提供安全保障或只是为了营造氛围。而作为照明领域重要组成部分的体育照明,对于光源的要求又有所不同。由于体育场馆的特殊性,既要求照明必须足够专业,又要求灯光能够随着比赛的切换而有所转变!
查看产品详情
凯发K8采用国外进口材料或国内一级原材料,从源头确保产品品质,通过行业多项检测标准认证,严格保证产品质量的优质性和稳定性,材料环保安全。

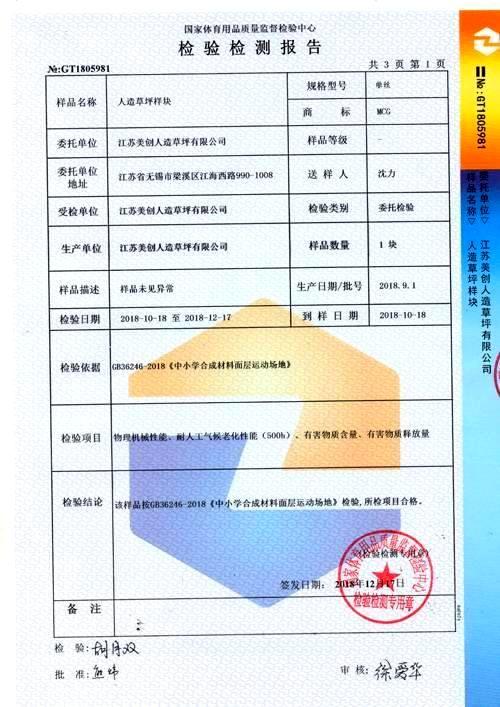
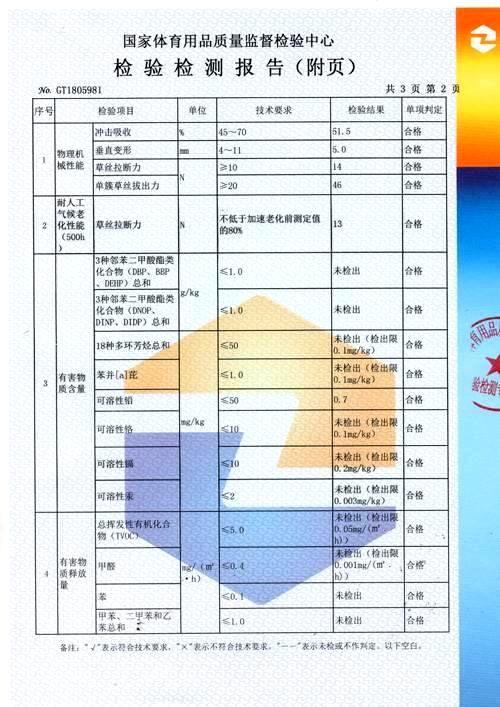
凯发K8运动面层材料通过新国标《GB 36246-2018 中小学合成材料面层运动场地》的全项检测,满足“上海团体标准2.0 ”,深圳等地方标准检测,权威认证,环保放心。

高聚物含量大于20%,特殊工艺处理,粘结力强,高弹性,拒绝场地开裂,拒绝太硬。使用寿命长达十年以上实践证明,不掉粒,无褪色,强力耐磨,安全耐用。

凯发K8采用进口先进生产设备和检测设备,施工工艺可靠,建立了高标准,严要求的产品研发及质量控制体系。

集合啦,集合啦,集合啦 开往绍兴的大巴 小伙们走过路过,都没错过, 凯发K8欢声笑语地开启了美好时光, 2019...
2018年12月3日下午1:38分,江苏凯发K8实业集团“大道直行...
10月7日,抓着国庆的小尾巴,凯发K8公司干部职员齐聚风景...
2016年,因全国各地中小学校爆发出多起“毒跑道”事件...
经过多年的发展,塑胶球场也经过了好几代的更替。球场材料的变更,一方面因为科技的进步促使更优越的替代品...
橡胶颗粒为塑胶跑道的基本基材之一,颗粒的质量直接影...
塑胶跑道工程,作为建筑行业的一个分支,经过多年的发...
在大中城市,幼儿园数量随着居民小区的新建而逐渐增加...
1、混合型塑胶跑道混合型塑胶跑道又称传统型跑道,呈平整密实型结构。混合型塑胶跑道一般用在专业的比赛...
标准的塑胶跑道每条道的宽度是1.22米,如果场地宽度比...
塑胶跑道简介:塑胶跑道又称全天候运动跑道,由聚氨酯...
塑胶跑道又称全天候田径运动跑道,它由聚氨酯预聚体、...
江苏盛世凯发K8实业发展有限公司,是一家专业从事体育运动场地咨询、设计、施工、销售及维护于一体的塑胶跑道、人造草坪等体育产品设施的综合性企业。凯发K8率先引进...
查看更多无锡市梁溪区江海西路990号智慧大厦1008室
1570556338@qq.com
400-928-9558
江苏盛世凯发K8实业发展有限公司 备案号: 苏ICP备18005553号-3
Jiangsu Shengshi Meichang Industrial Development Co., Ltd. 联系凯发K8
 .jpg "体育设施公司如何提供全方位解决方案") 体育设施公司如何提供全方位解决方案
体育设施公司如何提供全方位解决方案在现代社会中,人们对体育健身的重视程度逐渐增加,体育设施的建设和管理变得愈发重要。体育设施公司作为提供全方位解决方案的专业机构,在该领域发挥着重要作用。首先,身体健康被越来越多的人所重视,因此体育设施的需求也在不断增加。体育设施公司为了满足市场需求,不断研发创新的体育设施产品,如篮球场、足球场、网球场等,以及健身器材和运动设备等。这些产品不仅在建设方面具有领先技术,而且在运营管理上也提供专业的指导和支持。其次,体育设施公司拥有丰富的行业经验和专业知识,能够为客户提供量身定制的解决方案。无论是学校、社区、企业或政府机构,体育设施公司都能根据客户的实际需求和场地条件,提供最适合的设计方案和设备配置,确保体育设施的建设和运营达到最佳效果。此外,体育设施公司还致力于推动体育产业的发展,促进全民健身运动的普及和推...
体育设施是城市建设中一个重要的组成部分,不仅可以提供人们进行体育锻炼的场所,还可以促进社区活动和促进人们的健康。那么,关于体育设施,一般有多少种?这些设施又包括哪些内容?怎样才能充分利用这些体育设施呢...
体育设施是我们日常生活中不可或缺的一部分,提供了各种运动锻炼和休闲娱乐的场所。在快节奏的现代社会中,人们对健康和身体锻炼的重视越来越高,体育设施的利用变得更加普遍和重要。那么,我们应该如何正确利用体育...
体育设施在日常生活中扮演着重要的角色,不仅可以促进身体健康,同时也丰富了人们的生活。不过,对于许多人来说,了解不同体育设施的种类、价格和使用时长可能存在一定的困扰。那么,让我们来一起全面了解体育设施吧...
导语:体育设施在促进人们身心健康和社区发展方面扮演着重要的角色。本文将全面介绍体育设施的分类、建设过程以及如何提供更好的体育环境。一、体育设施的分类体育设施根据其用途和功能可以分为以下几类:1...
体育设施对于一个城市或社区的发展和居民的健康至关重要。但是,如何评估和选择适合的体育设施成为了一个需要仔细考虑的问题。下面我们将介绍一些关键因素,帮助您了解如何确定需要多少、哪个和哪些体育设施。首先...